MDx Reports: Report Thematics and Distributions
Thematic Color Palette
-
Click
 to choose from one of the 7 predefined thematic color palettes.
 -
Click a color scheme to use for your thematic map.
-
Click
 to close the Color Suggestions window.
To define your own palette:
-
Click one of the 9 colors swatches you want to change. The Color Palette window opens.
-
Select the color you want to use.
-
Repeat steps 1-2 for each custom color selection.
-
(Optional) To define a color not on the palette or to modify the opacity of the selected color click
 .
.-
In the text field enter the Hex Color Value of the color you desire.
-
To Modify Opacity slide the control bar or enter the percent value.
NOTE: Note an opacity value of 0 will make the color transparent.
-
Click Apply.
-
-
Click
to close the Color Palette window. -
Click Update Map.
Distribution Method
-
Equal Counts / Range: This selection evenly distributes the number of areas shown on the map across the number of ranges selected.
-
Equal Range Size: This selection evenly distributes the range of values across the number of ranges.
-
Auto Cluster: The Natural Breaks (or "Jenks") method distributes the values so that the average of each range is as close as possible to each of the values in that range. This method ensures that the ranges are well represented by their averages and that the values within each range are fairly close together.
-
Custom Ranges: Select this method to enable the Custom Ranges box and create your own ranges. Ensure there is no overlap in the range numbers you choose.
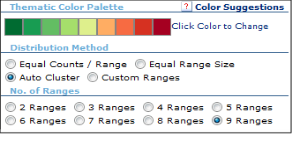
Number of Ranges
Select how many ranges the map and legend represent.
The number of ranges determines the number of thematic colors to use on the map. The colors used from the Map Color Palette will adjust according number of ranges selected. It will always use the first and last colors and adjust the remaining to best represent your palette.
Example palette with 9 ranges:
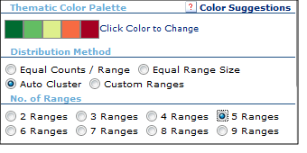
When 5 ranges are defined, then the system will use these colors out of the 9 defined. It is actually using these colors in order from left to right, 1-3-5-7-9 and suppressing colors in position 2-4-6-8.
Custom Ranges
The Custom Ranges will only be enabled if the selected Distribution Method is Custom Ranges. The number of custom ranges allowed to be entered depends on the Number of Ranges selected.
In the Custom Ranges text fields enter the set of values by which you want to group the data.
When entering the custom ranges, make sure that there is no overlap in the range values you choose.
Also having gaps in the range values entered results in values being omitted on the thematic map.
Enter values in the text fields in descending order, right text field represents upper bound of range and left field the lower bound.
Example of 5 ranges:
| 80 | - | 100 |
| 60 | - | 80 |
| 40 | - | 60 |
| 20 | - | 40 |
| 0 | - | 20 |