MDx Graphs: Set the Number of Indicator Groupings Shown
-
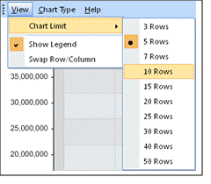
From the Graph View menu click View.
-
Click Chart Limit.
-
Select the number of rows. For chart readability at higher numbers, you may need to go back to the grid and restrict the number of demographic indicators.

Display/Hide Legend
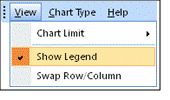
The legend always displays by default when a graph is generated, but it may be hidden which allows for a larger graph to be created.
-
From the Graph View menu click View.
-
Click Show Legend.
