Retail Target: Points Display
In Retail Target, you can overlay your retail sites map with a file of household points, customer points or other points of interests such as competitors.
Overlaying of existing customer points lets you confirm the true size and concentration of your trade areas. Competitor points helps you identify how many and which competitors are within the defined trade area.
Upload a file containing addresses or latitude/longitude values of your points of interests and these will be displayed as points on the map overlaid with your retail sites.
Geoscape also offers pre-loaded lists of major retailers from key sub-sectors available within the Advanced Package.
-
In the tool tabs click Map Settings.
-
Expand Points Display.
-
To upload new points, see Upload Display Points.
-
Click Add Display Points. The Display Points window displays and contains a tree with three nodes. Points of Interest contains pre-loaded lists of major retailers from key sub-sectors available within the Advanced Package, TrafficMetrix® contains traffic count data, and Uploaded Points contains files you have uploaded as display points.
-
Expand Points of Interest, TrafficMetrix or Uploaded Points. Select a list and click Add.
-
Points of Interest is adaptive and the locations listed is controlled by the current DMAs in your map view, thus including major regional and local chains.
-
Note for Retailers: the whole sub-sectors or individual locations may be selected as points to display. For example, you can select the sub-sector Fast food restaurants and click Add. Or, you could select individual restaurants listed and click Add to include in the Selected Points List.
-
Those licensed to Retailer Point Details may also purchase plotted sites.
-
-
Click the Color Swatch to change the color of the point marker.
-
Select the color from Color Palette, then click
 to close the Color Palette window.
 -
In the Size text field, enter the value of the size marker you want to display on the map.
-
Select type of marker, either the pin or dot radio button.
-
To remove a selection click X.
-
Click Update Map.
-
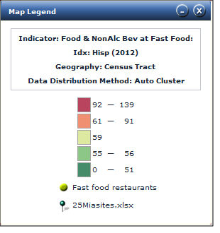
The selected points display on the map and are represented in the legend.
-
Click either Point Summary or Points Detail to obtain display point analysis reports.
NOTE: Advanced Retail licensed users may save Point Summary Counts as site data by clicking the save icon of the corresponding display point.
Classifying Point Data
The Retail Target Advanced features license provides you the ability to upload site specific data along with your display point list. The classify point option let's you visually represent distributed values on a thematic map and legend of point site data. This helps you better identify important patterns, within the points of interest displayed.
-
In the tool tabs click Map Settings.
-
Expand Points Display.
-
To upload new points, see Upload Display Points. (To review content of a previously uploaded file see Preview.)
-
Click Add Display Points. The Display Points window displays and contains a tree with three nodes. Retailers contains pre-loaded lists of major retailers from key sub-sectors based on the DMA in view and TrafficMetrix data that provides traffic count information on specific point within your view both available with the Advanced Retail Package. The Uploaded Points node in tree contains files you have uploaded as display points and allows you to select point site data.
-
Expand either Points of Interest, TrafficMetrix or Uploaded Points and corresponding point file and select desired traffic count or point site data indicator and click Add.
-
TrafficMetrix points may only be displayed at a zoom level 12 or higher.
-
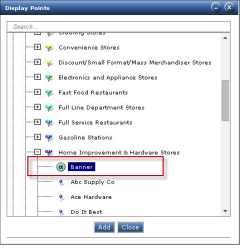
Retailers: select the Banner indicator listed below the main category.
-
-
In the Size text field enter the value of the size marker you want to display in the map.
-
Select the type of marker, either pin or dot radio button.
-
Select the Classify check box.
-
To define Thematic Options for the point data selected click the Three Split Pins
 icon. Please refer to Thematic Map Options: Distribution Method for explanation of settings.
 -
For non-numeric values, when more values are returned than ranges defined the system automatically assigns colors.
-
-
To remove a selection click X.
-
Click Update Map.
-
The selected points currently in view are thematically displayed on the map and are represented in the legend. To learn about color locking the colors represented by your point data, refer to Legend Color Locking.
Below are two examples :
-
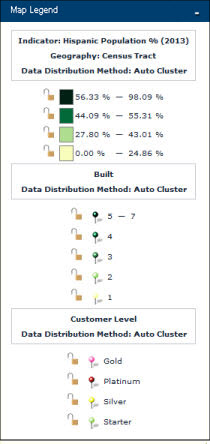
The first legend example displays classified POI data, both numeric and text data, that was uploaded via a display point file.
-
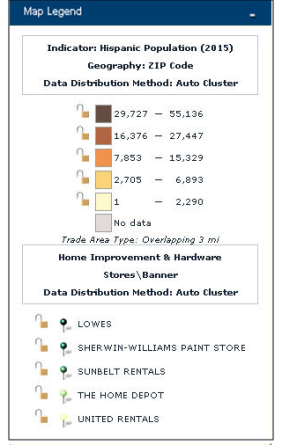
The second legend example displays the current Hardware Stores in view based on the Banner indicator selected.
-
Filter Points Displayed Based on Point Data
Retail Target provides you the ability to upload site specific data along with your display point list. The point filter option lets you specify which points to include/exclude in your maps and reports, thus allowing for more flexible and precise analysis. (Access to this feature depends on license.)
-
In the Tool tab, click Map Settings.
-
Expand Points Display.
-
To upload new points, see Upload Display Points. (To review content of a previously uploaded file see Preview.)
-
Click Add Display Points. The Display Points window displays and contains a tree with three nodes. The Uploaded Points node in tree contains files you have uploaded as display points and allows you to select point site data when defined. Examples of site data include store sales, store name, customer sales, etc.
-
Expand Uploaded Points. Expand the desired point of interest and select a point site data indicator and click Add.
Notice the point site data indicator gets listed under Selected Points List and the Point Project List name gets listed under POI Filters. -
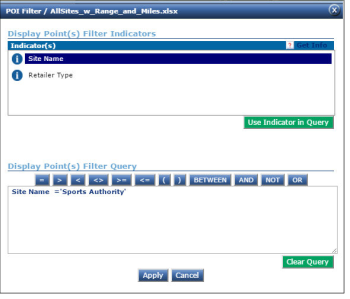
Click the Filter
 icon. The Display Points Filter window displays. The indicators listed are all the point site data values defined for the specified POI project. Query may contain one or more of these indicators.
 -
From the list of Display Point(s) Filter Indicators, select an indicator, and click Use Indicator in Query or double-click the indicator name to include it in the Filter Query text field.
Important: Only the listed indicators may be included in query. -
Click the desired operator. Operator is added to the query editor. The following operators can be used by clicking any one of them following an Indicator to perform a query:
-
Equal (=)
-
Greater Than (>)
-
Less Than (<)
-
Not Equal (<>)
-
Greater Than or Equal To (>=)
-
Less Than or Equal To (<=)
-
Parenthesis
-
Between
-
AND, NOT and OR
-
-
Place cursor in query editor and enter desired value. String values need to be enclosed in quotes.
-
Click Apply.
Example
Site Name ='Sports Authority'
(this will identify sites who's site name is Sports Authority )
-
Click Update Map.
-
Points will be colored for those sites that match query criteria.
Important: Those points that do not match the filter are not displayed nor counted in the Point Summary and Points Detail Reports. The Filter will also affect any corresponding Point Aggregate or Site Virtual Indicator results. -
To disable the defined query deselect the check box next to the filter string.
