Interpret a Profile Output
When a profile creation job has been submitted, you can view the profile generation status on the My Jobs screen.
NOTE: The generated profiles are also saved to your My Content.
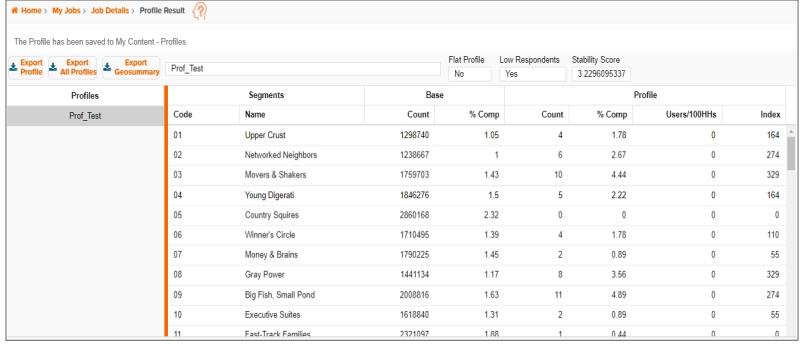
Once the job has been completed, you can view the profile by clicking the row or the job ID number of the profile creation job. The Profile Results screen appears showing the Segment information, Base and Profile measures, Flat Profile and Low Respondents classification, and Stability Score.
You can export a profile by clicking the name of the profile that you want to export and then clicking Export Profile.
You can export all profiles listed in the Profiles column by clicking Export All Profiles.
You can export only the geosummary files by clicking Export Geosummary.

To Learn More:
|
|
- Flat Profile: Indicates if the profile is not recommended to be used for predicting behavior because of the high frequency of use (Profile Count). Any profile or behavior with more than 50% frequency or usage (i.e., Profile Count is more than half of Base Count) is considered a flat profile.
- Low Respondents: Indicates the quantity of responses gathered for a segment. A small change can result in a large shift in the profile. These large shifts then translate to an unstable profile. More specifically, counts below 1000 mean that there may be as few as 15 responses in a segment (if the responses are evenly distributed across the 68 segments of Claritas PRIZM Premier, for example). Therefore, slight changes in response number, even by as few as 5 responses moving from one segment to another, will create a very different profile from one year to the next.
- Stability Score: Shows the score that is based on a Chi Squared expected counts rule of thumb, which suggests a cell (segment count) should have at least five expected positive observations (responses). The expected count of each segment (based on the overall profile penetration and the base segment count) is calculated, and then averaged after capping at 5 for each cell. The maximum stability score is 5. Profiles that have a score of 4.3 or greater can then be put through a lift analysis to determine whether the profile of the behavior is independent from the profile of the base.
- Segment Code/Segment Name: Identify each segment (row).
-
Base Count: Shows the total number of households that fall in the segment in the select area(s).
The Base Count is used to calculate how each segment fits the product usage profile, compared to other segments. If you select multiple profiles from the same data source, the segment’s Base Count for each segment is constant for those profiles. - Base % Comp: Shows the proportion of segment households compared to the total number of households in the Base Count column.
If you selected profiles from the same data source, the segment’s Base Percent Composition is constant for those profiles. - Profile Count: Shows the total number of surveyed households/adults in each segment that reported using the product or service. If multiple adults in the same household use the product or service, the Profile Count can be higher than the Base Count.
-
Profile % Comp: Shows the proportion of segment households/adults that fit the profile, compared to the profile’s total Count. It represents the percentage of households/adults using the product profile compared to the total number of all households using the product. If multiple adults in the same household use the product or service, the segment counts and composition percentages will be higher. It is calculated by dividing the value in a row by the total of its column.
-
Profile Users/100HHs: Shows the percentage of households/adults that fit the profile (Count) compared to all households in the segment (Base Count). It is calculated by dividing the count in a row by the base count in the same row.
- Profile Index: Compares the proportion of households/adults that fit the profile (% Comp) compared to the proportion of all households in the segment (Base % Comp).