Custom Reports: Edit Table
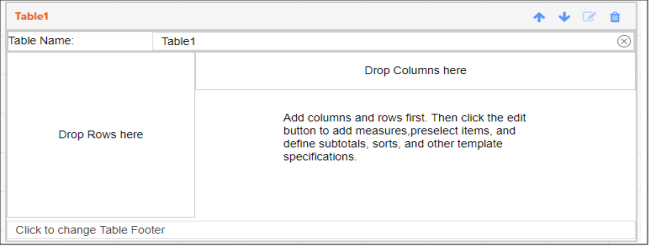
Once a table has been added to your template, click the edit icon (![]() ) to add any desired pre-selections to the table.
) to add any desired pre-selections to the table.
Pre-selections that can be made may include:
- Selecting analysis areas
- Selecting variables and measures
- Selecting profiles and measures
- Selecting targets
- Setting sort and subtotal options
To ensure system performance, report limitations have been implemented for tables included in custom reports. The limits can be viewed here.
NOTE: Any pre-selections made here will remain fixed on the report, and not able to be changed when you run a report using the saved template.
After verifying your selections, click OK.
To Learn More:
NOTE: The elements you select for your table's rows and columns, will determine which of the following tabs will be available for making pre-selections.
- Once a table has been added to your template, click the edit icon (
 )
)
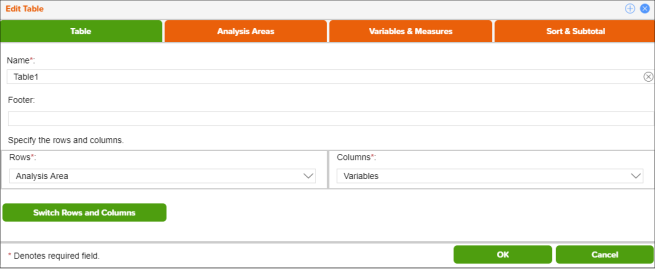
- Edit the general details of the table on the Table Tab:
- Update the table name and table footer.
- Specify the elements to be used as the table rows and columns.
- Transpose the elements being used for the rows and columns.
- (Optional) If Profiles or Targets is one of the selected table elements, you will be prompted to select a segmentation system.
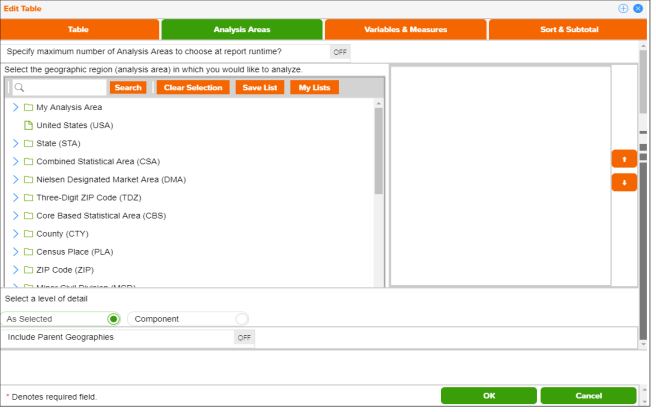
- Select the analysis areas you'd like included in the table on the Analysis Areas Tab:
- (Optional) To specify the maximum number of Analysis Areas to choose at report runtime click the OFF button to set it to ON. You will then be prompted to specify the maximum number of analysis areas for the table.
- Navigate to and select the geographies or analysis areas to include in your table.
Selected areas will appear in the selection pane on the right side of the screen. -
Below Select a level of detail, click the option that best describes how you want to arrange your selected geographies or analysis areas in your table. The options are:
- As Selected - Reports data for each analysis area (aggregate or component) in the selected order.
- Component - Reports data for all the analysis area components you select (State, County, ZIP Code, etc.). If you select this option, you need to select a geography level to use as component and the method by which you want to include the geographies.
-
To append parent geographies to the table output, click the OFF button next to Include Parent Geographies to set it to ON. When the Parent Geography pop-up window appears, click the Name and/or Code check box next to the parent geography(ies) that you want appended.
NOTE: If the selected output type is interactive, and you select to include parent geographies during the template creation process, the Parent Geography feature in the interactive report output will not be available.
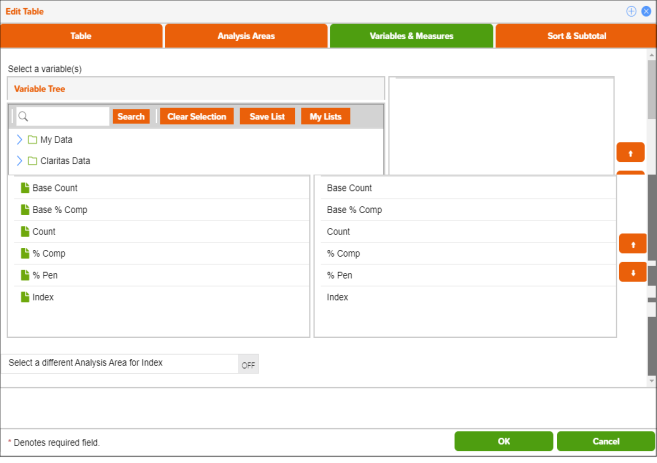
- Select the variables and variable measures you'd like included in the table on the Variables & Measures Tab:
This tab will be available if you have selected Variables as one of your table elements.
- Navigate to and select the variable(s) that you'd like to include in your table.
Selected variables will appear in the selection pane on the right side of the screen. - Select the variable measures that you'd like to include in your table.
The default is set to include all measures. - (Optional) If you are creating an Analysis Area by Variables or Variables by Analysis Areas table, specify how you would like the index calculated:
- If you leave the Select a different Analysis Area for Index as OFF, the selected analysis areas will be the base for the index calculation.
- If you set the Select a different Analysis Area for Index to ON, you will then be prompted to select the geography that you would like used for the index calculation.
Note: Setting this option to ON will allow you the ability to select a consistent geography for calculating index, regardless of the number of analysis areas selected.
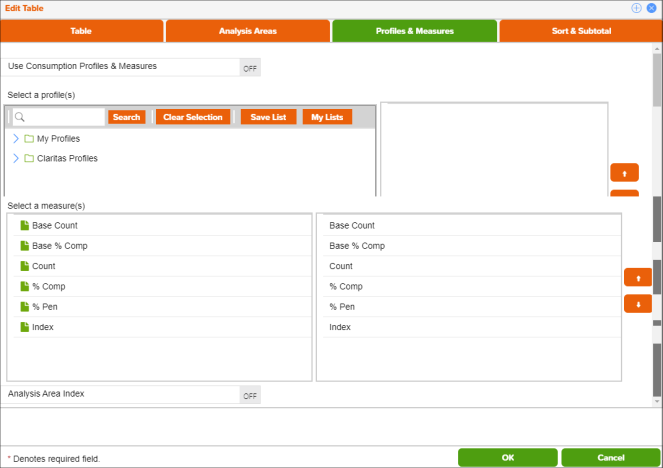
- Select the profile and profile measures you'd like included in the table on the Profiles & Measures Tab:
This tab will be available if you have selected Profiles as one of your table elements.
- Set the Use Consumption Profiles & Measures prompt from OFF to ON if you would like to use a consumption profile and view the consumption data as part of your table.
- Navigate to and select the profile(s) that you'd like to include in your table.
Selected profiles will appear in the selection pane on the right side of the screen. - Select the profile measures that you'd like to include in your table.
The default is set to include all measures. - (Optional) If you are creating an Analysis Area by Profiles table, specify how you would like the market potential index calculated:
- If you leave the Analysis Area Index as OFF, the index will be calculated based on the total U.S.
- If you set the Analysis Area Index to ON, the index will be calculated based on the extent of the selected analysis area(s).
- (Optional) If you are creating a Profiles by Targets table, specify if you would like the data projected to an analysis area:
- If you leave the Analysis Area Projection as OFF, the counts in the report will be left at the total profile level.
- If you set the Analysis Area Projection to ON, the counts in the report will be projected to an analysis area that you will be prompted to select.
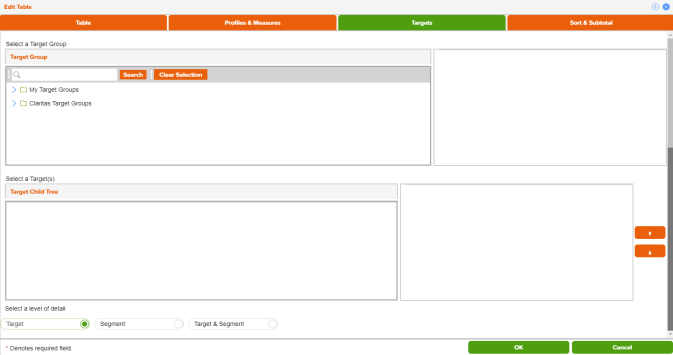
- Select the targets you'd like included on the Targets Tab:
This tab will be available if you have selected Targets as one of your table elements.
- Select the target group the desired targets belong to.
The selected target group will appear in the selection pane on the right side of the screen. - Navigate to and select the target(s) that you'd like to include in your table.
Selected targets will appear in the selection pane on the right side of the screen. - Below Select a level of detail, click the option that best describes how you want the target information displayed in your table. The options are:
- Target - Displays each selected target as an individual set of columns in the report.
- Segment - Displays only the target’s segments in separate columns.
- Target & Segment - Displays columns for each target and for each segment in the selected target.
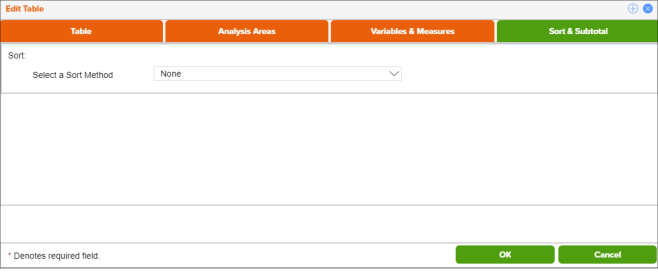
- Set the sort and subtotal options on the Sort & Subtotal Tab:
NOTE: If the Analysis Area element is selected for the columns, you will not have the option to Sort & Subtotal the table.
-
Select a Sort Method. The options are:
- None - No sort method is applied.
- Row ID - Sorts data according to row ID.
- Row Name - Sorts data according to name in alphabetical order.
- Report Selection - Sorts data based on a specific variable and measure.
- First Target/Segment - Sorts data based on your target or segment selections.
- (Optional) If you select Row ID or Row Name as the sort method, you need to specify a Sort Direction.
-
(Optional) If you select Report Selection as the sort method, you need to specify a Sort Direction, Sort Variable or Profile, and Sort Method. You will also need to select a Subtotal Method. The options are:
- None - No method is applied.
- N-Tile - Distributes the total number of records into groups that are approximately equal, such as fourths or fifths.
You will also need to specify the Number of Ranges, Subtotal Measure, and Color Scheme. - Equal Ranges - Groups areas (rows) based on the values of a specific variable – Each subtotal group will have an equal minimum/maximum range for the specified variable.
You will also need to specify Number of Ranges and Color Scheme. - Equal Records - Uses basic division to group the number of records (rows) equally – Each subtotal group will have an equal number of records.
You will also need to specify Number of Ranges and Color Scheme - Analysis Areas - Groups the rows by the selected analysis areas.
You will also need to specify how to display and calculate data for each duplicate geography and color scheme. - Manual - Groups the areas (rows) based on the values of a specific variable - The minimum/maximum values for each subtotal group is set by the user.
You will also need to specify the Number of Ranges, Color Scheme, and the minimum/maximum values for each subtotal.
- (Optional) If you select First Target/Segment as the sort method, you need to specify a Sort Direction and Sort Measure. You will also need to select a Subtotal Method. The options are:
- Tops & Bottoms - Displays a specified number of top and bottom entries.
You will need to select the number of top/bottom records to display. - Tops - Displays a specified number of top entries.
You will need to select the number of top records to display. - Bottoms - Displays a specified number of bottom entries.
You will need to select the number of bottom records to display.
- Tops & Bottoms - Displays a specified number of top and bottom entries.
- After verifying your selections, click OK.
What's Next:
To update the details of your report map, go to Custom Report: Edit Map.
To modify the layout of your template, go to Custom Report: Modify Template.
To run a report using your saved template, go to Custom Report: Run a Report Using a Saved Template.