MDx Reports: Work with Grids
To view the MDx report in grid view, select Grid View from the tab options on top of the report. This is the default option selected when a report initially loads.
The MDx tables, or "grids," allow you to customize the geographical and demographic focus of your query and to copy or export the data to a variety of formats.
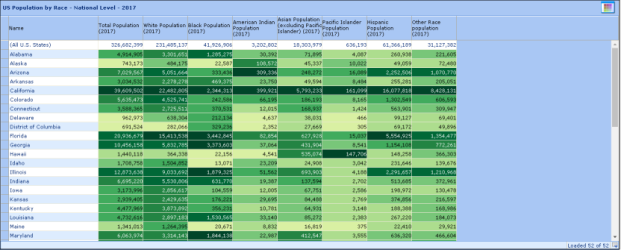
For DMA Level; DMA, County, Zip Code Level; and Metropolitan Level reports, the first 50 records are initially shown. 
To show the next 50 records, you can do one of the following:
-
Scroll to the bottom of the report and the next 50 records will automatically be retrieved and displayed.
-
Click the Load More Data icon at the bottom of the report.
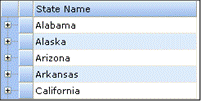
For DMA, Country, ZIP Code Level and State, County, ZIP Code Level reports, the data is presented in a hierarchical format. To zoom in or expand table entries, click the  beside the level.
Thematic Shading
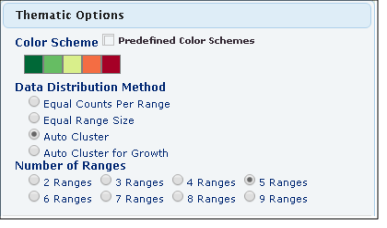
Each column of the MDx result report grid is thematically shaded based on the values returned. How and what colors are used are controlled by your settings.
To define your settings:
-
Click
 , the Thematic Options window displays.
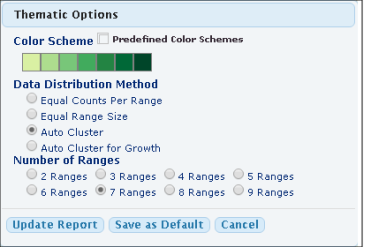
Color Scheme
-
Click
 . The Color Schemes window opens with 9 predefined thematic color palettes.
 -
Click a color scheme to use for your report. Color scheme is selected and the window closes.
Define Your Own Palette
-
Click one of the 9 colors swatches you want to change.

-
The Color Palette window opens.
-
Select the color you want to use.
-
Repeat steps 1-3 for each custom color selection.
-
(Optional) To define a color not on the palette or to modify the opacity of the selected color click
 .
.-
In the text field enter the Hex Color Value of the desired color.
-
To modify the opacity slide the control bar or enter the percent value.
NOTE: Note an Opacity value of 0 will make the color transparent.
-
Click Apply.
-
-
Click
 to close the Color Palette window.
 -
Click Update Report.
Distribution Method
-
Equal Counts per Range: This selection evenly distributes the values returned for the areas into the number of ranges selected.
-
Equal Range Size: This selection evenly distributes the range of values (from minimum to maximum) across the number of ranges.
-
Auto Cluster: The Natural Breaks (or "Jenks") method distributes the values so that the values in each range are as close as possible to the average for that range. This method ensures that the ranges are well represented by their averages and that the values within each range are fairly close to the average.
-
Auto Cluster for Growth: Distributes the values so that the values in each range are as close as possible to the average for that range. This method also isolates negative values from positive values by representing them with different colors.
Number of Ranges
Select into how many ranges you want to separate the data results.

The number of ranges determines the number of thematic colors used in the report. The colors used from the color palette will adjust according number of ranges selected. It will always use the first and last colors and adjust the remaining to best represent your palette.
Example palette with 9 ranges:
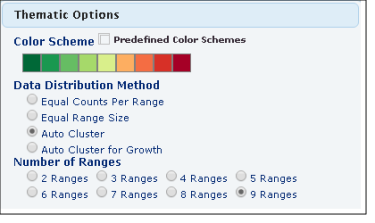
When 5 ranges are defined then the system will use these colors out of the 9 defined. It is actually using these colors in order from left to right, 1-3-5-7-9 and suppressing colors in position 2-4-6-8.
Example palette with 5 ranges:
Save Settings
To retain your selections for all future MDx reports click Save as Default.