MDx Reports: Working with Graphs
To view the data in a graph, click Graph View tab on top of the report.
The graph, which defaults to the 3-D Column Chart format, will display the first 5 rows shown in your grid view. The legend is also initially displayed by default.
Use the drop-down menus above the MDx Graph to change the look of the graph.

View

Limit the number of rows displayed on the chart through the Chart Limit menu. By default, the graph displays the first 5 rows shown in the Grid View. Alternately, show/hide the legend through the Show Legend menu which is shown by default. Interchange the geography with the indicator in the graph using the Swap Row/Column Menu.
Chart Type

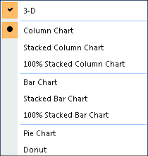
Choose from 5 chart types available, Column Chart, Column Chart Side-by-Side, Horizontal Bar Chart, Pie Chart and Donut.
View the charts in 3-D format.
For Pie Chart and Donut, you may also show the chart in Exploded Slices.
For Column Chart, Column Chart Side-by-Side and Horizontal Bar Chart, you can design the chart Stacked or in Cylinder.
Geographic Level

This menu option will only be available if you are viewing a State, County, ZIP Code level or DMA, County, ZIP Code level report. Change the geography displayed on the graph by changing the geographic level from the menu options.
Help

Click on the Help Topics to open up the on-line help. Click on the Methodology Statement to learn more about how the data shown in the report was developed.
Display the Actual Value of Chart
In the chart rest the cursor on top of the bar that you would like to see the Value.
