Interactive Report Output
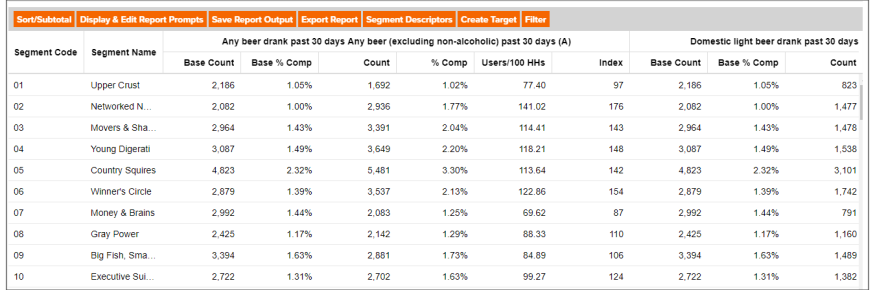
If you selected Interactive as your report output format, the system generates your report and displays it on the Interactive Report screen. This screen allows you to do the following (some of the functions are still under development):
- View the report map
- Sort/Subtotal the data
- Edit the report prompts
- Export the report
You can view the interactive report generation status on the My Jobs screen.
To Learn More:
Interactive Report Output Options Walkthrough
- To view the report content, use the sliders located on the right side and on the bottom of the report screen.
-
To view the report map, click the View Map button. The screen displays the report map with a View Report button.
To return to the Interactive Report screen, click the View Report button. - To sort and subtotal the data, click the Sort/Subtotal button.
Sort and subtotal setting prompts and their corresponding options will vary depending on the type of report that was created. The prompts can include:
| Sort/Subtotal Prompt | Additional Information |
| Sort method |
Sort methods can include: Segment, Row ID, Row Name, and Report Selection. The selected sort method will affect which of the remaining sort/subtotal options will appear. |
| Sort direction | The options are ascending and descending. |
| Subtotal method |
The subtotal methods can include:
|
| Subtotal measure | Sets the measure that will be used for the basis of subtotaling. |
| Number of ranges | Sets the number of subtotal groups included in your report. |
| Sort variable / Sort profile | This is the variable or profile that the report will be sorted on. |
| Sort measure | This is the measure tied to the sort variable/profile that will be used for the basis of sorting. |
- To update the report data, click Display & Edit Report Prompts. A screen appears with your initial prompt selections. Edit the information as needed and regenerate the report by selecting Submit on the final report prompt screen.
- To save the report to My Content, click Save Report Output. Click OK.
- To export the report to Excel, click Export Report. Select whether you want to include the Report Title, Table View, and/or Map. Click OK.
NOTE: The exported/downloaded report appears on the bottom of the screen. You can click the report to open and view the report content.
- To append segment descriptors to the report, click Segment Descriptors. When the Segment Descriptors pop-up window appears, click the box(es) next to the descriptors you want appended to the report. Click OK.
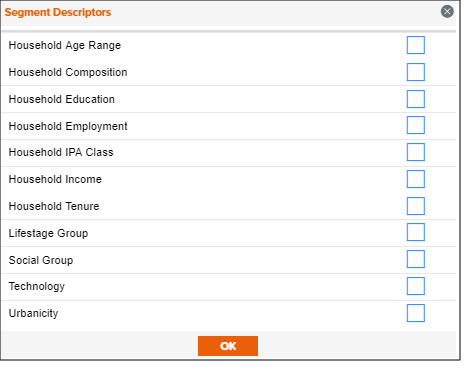
NOTE: The Segment Descriptors button is only available for reports where the detailed rows contain segment level information.
- To append parent geographies to the report, click Parent Geography. When the Parent Geography pop-up window appears, click the Name and/or Code check box next to the parent geography(ies) that you want appended to the report. Click Submit.
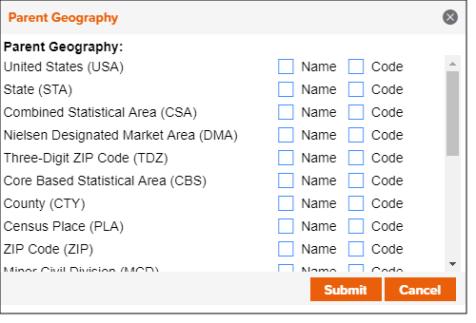
NOTE: The Parent Geography button is only available for reports where the detailed rows contain geography level information.
- To create targets using the selected rows in your report output, click Create Target. When the Target Group Creator screen appears, name your target and click Create Target Groups.
Note that you must have selected rows within the report before the Create Target button becomes active.
For additional information on creating targets, view the Target Builder Help.
NOTE: The Create Target button is only available for reports where the detailed rows contain segment level information.
- To create analysis areas based on the selected rows in your report output, click Create Analysis Area. When the Create Analysis Area window appears, enter the desired analysis area name. Click Ok.
Note that you must have selected rows within the report before the Create Analysis Area button becomes active.
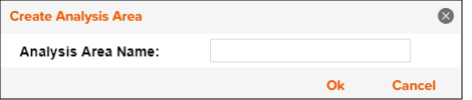
NOTE: The Create Analysis Area button is only available for reports where the detailed rows contain geography level information.
-
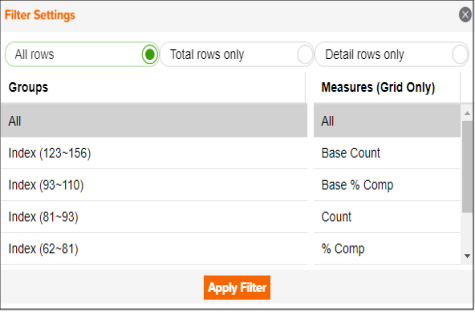
To filter the rows and/or columns in your report grid, click Filter. When the Filter Settings window appears, select if you would like to view All rows, Total rows only, or Detail rows only. Then, select which subtotal groups (rows) and which measures (columns) you would like displayed in the report grid. Click Apply Filter.
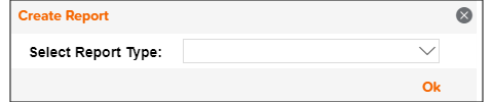
- To a launch a report using the selected geographies in your report output, click Create Report. When the Create Report window opens, select the report you'd like generated and click Ok.
Note that you must have selected rows within the report before the Create Report button becomes active.
NOTE: The Create Report button is only available for reports where the detailed rows contain geography level information.
What's Next:
View the Job Status/Output File