Market Potential Report: Specify the Sort Method, Report Output Type and Report Name
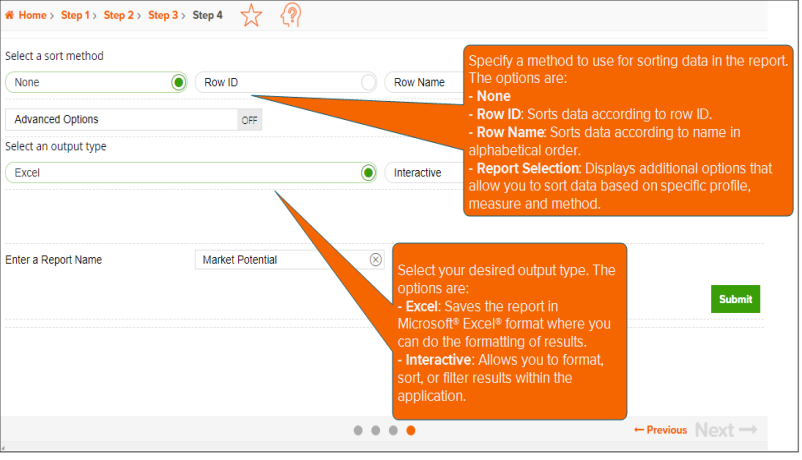
On the screen similar to the one shown below, specify your preferred sort method, output type and the name for your report.
(Optional) You can also set additional options such as including a map and/or including optional variable(s) in your report by enabling the Advanced Options option.
NOTE: The Step number assignment that displays on top of the screen and the available options may differ depending on your selections on the previous screen, your device, and/or your screen resolution.
After verifying your selections, click Submit.
NOTE: If you have selected more than 10,000 custom analysis areas and/or 30 profiles, you will receive a message and be returned to your report selections so they can be modified. You will then need to update your report selections and re-submit your report.
To Learn More:
NOTE: Depending on your screen resolution or device, some of the options mentioned below may not appear on this screen and you may need to go to the previous or next screen to complete the process. Simply follow the instructions below to set those parameters or refer to the Help provided for the previous or next screen.
- (Optional) Specify a method to use for sorting data in the report. The options are:
- None - No method is applied.
- Row ID - Sorts data according to row ID.
- Now Name - Sorts data according to name in alphabetical order.
- Report Selection - Sorts data based on a specific profile and measure.
- (Optional) If you selected Report Selection as your sort method, you need to specify a sort profile and sort measure.
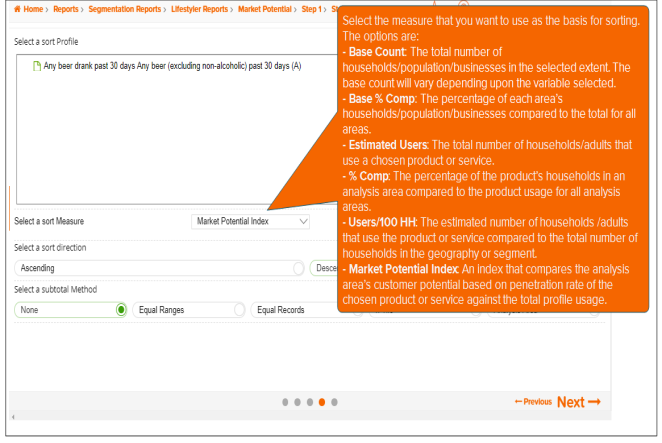
- Specify your preferred sort direction. The options are Ascending and Descending.
- (Optional) If you selected Report Selection as your sort method, you need to specify a subtotal method for sorting the data in your report. The subtotal method options are:
- None: No method is applied.
- Equal Ranges: Groups areas (rows) based on the values of a specific variable – Each subtotal group will have an equal minimum/maximum range for the specified variable.
- Equal Records: Uses basic division to group the number of areas (rows) equally – Each subtotal group will have an equal number of areas.
- n-Tile: Distributes the total number of households in an area into groups that are approximately equal, such as fourths or fifths. Dividing data in equal portions ranks the analysis areas by marketing potential, in groups showing the strongest to weakest.
- Analysis Area: Groups the records by the selected analysis areas.
- If you selected the Equal Ranges or Equal Records subtotal method, you need to specify the following:
- Number of ranges: In the Select the number of ranges drop-down list, click your desired number of groups.
- If you selected the n-Tile subtotal method, you need to specify the following:
- Number of ranges: In the Select the number of ranges drop-down list, click your desired number of groupings.
- Subtotal measure: In the Select a Subtotal Measure drop-down list, click the desired measure to use for equal grouping.
- If you selected the Analysis Area subtotal method, you need to specify the following:
- Display and calculate data for each duplicate geography. The options are:
- Only once: The report output will not contain any duplicate records (geographies).
- In subtotals only: The report output will contain any duplicate geographies in the subtotals, but not the total.
- In all totals: The report output will contain duplicate geographies in both the subtotals and total.
- (Optional) To enable the available advanced options for this report, do the following:
- Click the OFF button next to Advanced Options to set it to ON. Prompts to select optional variable(s) and include a map appear.
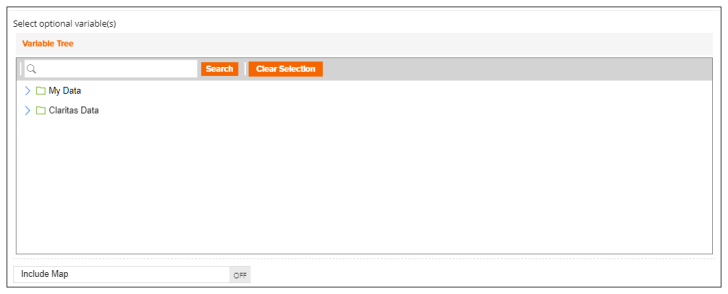
- Navigate to and select your optional variable(s) for which you want to include in the report. You can also use the Search function to look for your desired variable.
- If you want to include a map, click the OFF button next to Include Map to set it to ON. Additional options appear.
- In the Select a color scheme drop-down list, select the color theme that you want to use in your map.
- By default, Include Labels is set to ON. To disable the labels, click the button to set it to OFF.
- Select your desired output type. The options are:
- Excel: Saves the report in Microsoft® Excel® format where you can do the formatting of results.
- Interactive: Allows you to format, sort, or filter results within the application.
- Type a name for your report in the Enter a Report Name text box.
- Verify your selections and then click Submit.
- When a message box appears giving you the following options, click the next action that you want to do:
- Create another report of this type: Takes you to the appropriate report prompts for the current report that you are generating.
- Create a different report type: Takes you to the Reports home page.
- Go to My Content: Takes you to the My Content page, where you can access all generated assets.
- Go to My Jobs: Takes you to the My Jobs screen, where you can view the report generation status and the generated report.
NOTE: If you do not click any of the options, the system automatically takes you to the Job Export page containing tiles for possible actions on what you can do with your output.
If you selected the Interactive output type, the system takes you to the Interactive Report screen where you can format, sort, and/or filter the results.