Pop-Facts Demographics by Age, Race, Sex Report: Select an Analysis Area, the Level of Detail, and a Report Generation Method
On the Step 1 screen, select a geography or an analysis area for which you want to generate a report, the level of detail that you want to include in your report, and your preferred report generation method.
Additional considerations:
- When selecting the analysis areas or standard geographies you want to include in the report, clicking on the folder (without opening it) will select all areas contained within the folder.
- Use the Search function to locate your desired analysis areas.
- Use the Save Selection button to save your selected list of analysis areas for future use.
- Use the Load Selection button to load a previously saved list of analysis areas.
- You can specify to include details about your selected analysis area.
- You can include a chart and/or map in your report.
After verifying your selections, click Next to proceed.
To Learn More:
NOTE: Depending on the device that you are using and your screen resolution, some of the fields or parameters mentioned in this procedure may appear on the next screen. Simply follow the instructions below to set those parameters.
- On the Step 1 screen, navigate to and select the geography or analysis area for which you want to generate a report. You can also use the Search function to look for your desired area.
-
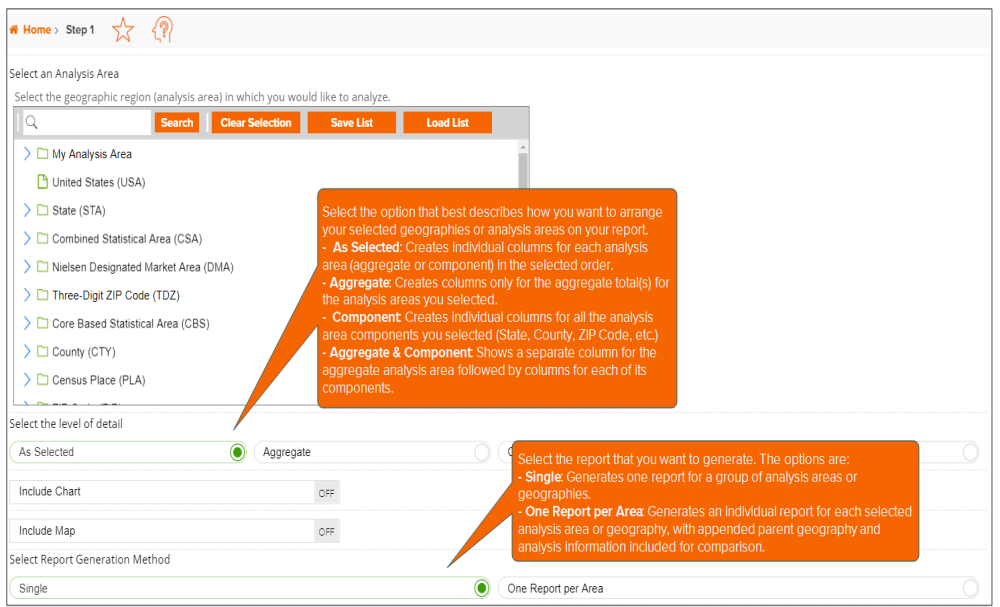
Below Select the level of detail, click the option that best describes how you want to arrange your selected geographies or analysis areas on your report. The options are:
-
As Selected: Creates individual columns for each analysis area (aggregate or component) in the selected order.
-
Aggregate: Creates columns only for the aggregate total(s) for the analysis areas you selected.
-
Component: Creates individual columns for all the analysis area components you selected (State, County, ZIP Code, etc.). If you select this option, you need to select a geography level to use as component and the method by which you want to include the geography.
-
Aggregate & Component: Shows a separate column for the aggregate analysis area followed by columns for each of its components. If you select this option, you need to select a geography level to use as component and the method by which you want to include the geography.
- (Optional) If you want to include a chart, click the OFF button next to Include Chart to set it to ON.
- (Optional) If you want to include a map, click the OFF button next to Include Map to set it to ON.
- (Optional) If you selected to include a map to your report, additional options appear on the screen. You can do the following:
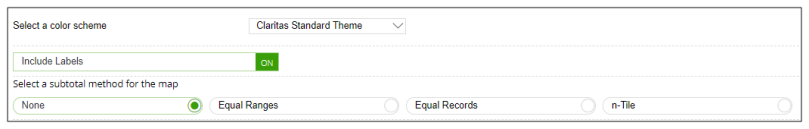
- In the Select a color scheme drop-down list, select the color theme that you want to use in your map.
- (Optional) By default, the labels are ON if you select to include a map. To disable the label display on the map, click the ON button next to Include Labels to set it to OFF.
- Select the level of detail that you want to include in your map. The options are:
- As Selected: Your report's thematic map is applied to the selected analysis areas.
- Component: Your report's thematic map is applied to the components of the analysis areas. If you select this option, you need to select a geography level to use as component and the method by which you want to include the geography.
- As Reported: Your report's thematic map is applied based on report grid selections.
- Select a subtotal method. The options are:
- None
- Equal Ranges: Groups areas (rows) based on the values of a specific variable – Each subtotal group will have an equal minimum/maximum range for the specified variable.
- Equal Geographies: Uses basic division to group the number of areas (rows) equally – Each subtotal group will have an equal number of areas.
- n-Tile: Distributes the total number of households in an area into groups that are approximately equal, such as fourths or fifths. Dividing data in equal portions ranks the analysis areas by marketing potential, in groups showing the strongest to weakest.
- (Optional) If you select Equal Ranges, Equal Geographies, or n-Tile subtotal method, you have to specify the following:
- Theme variable: The break variable is available only for n-Tile subtotal method. Select the variable that you want to use for theming or breaking or grouping data in the Select a theme variable box.
- Sort measure: In the Select a sort measure drop-down list, click to select the calculation that you want to use for sorting data. The options are:
- Base: Shows the total number of households that fall in the segment.
- Base % Comp: Shows the proportion of segment households compared to the total number of households in Base Count.
- Count: The total number of surveyed households/adults in each segment that reported using the product or service.
- % Comp: Shows the proportion of segment households/adults that fit the profile, compared to the profile’s total Count.
- % Pen: Shows the percentage of households/adults that fit the profile (Count) compared to all households in the segment (Base Count)
- Index: Compares the proportion of households/adults that use the product (% Comp) compared to the proportion of all households in the segment (Base % Comp). - Sort order or direction: Below Select a sort direction, click your desired sort order. The options are Ascending and Descending.
- Number of ranges: In the Select the number of ranges list, click your desired number of groupings.
- Below Select Report Generation Method, specify whether you want to generate just a single report for all areas (i.e., Single) or an individual report per area (i.e., One Report per Area).
- Click Next to proceed.
To Learn More:
Pop-Facts Demographics by Age, Race, Sex Report: Define the Report Output Format and Name