Pop-Facts Demographic Trend Report: Define the Report Sections and Generation Method
On the screen similar to the shown below, specify your desired report sections to include and the report generation method.
NOTE: The Step number assignment that displays on top of the screen and the available options may differ depending on the selections that you have made on the previous screen, your device, and/or your screen resolution.
After verifying your selections, click Next to proceed.
To Learn More:
NOTE: Depending on your screen resolution or device, some of the options mentioned below may not appear on this screen and you may need to go to the next screen to complete the process. Simply follow the instructions below to set those parameters or refer to the Help provided for the next screen.
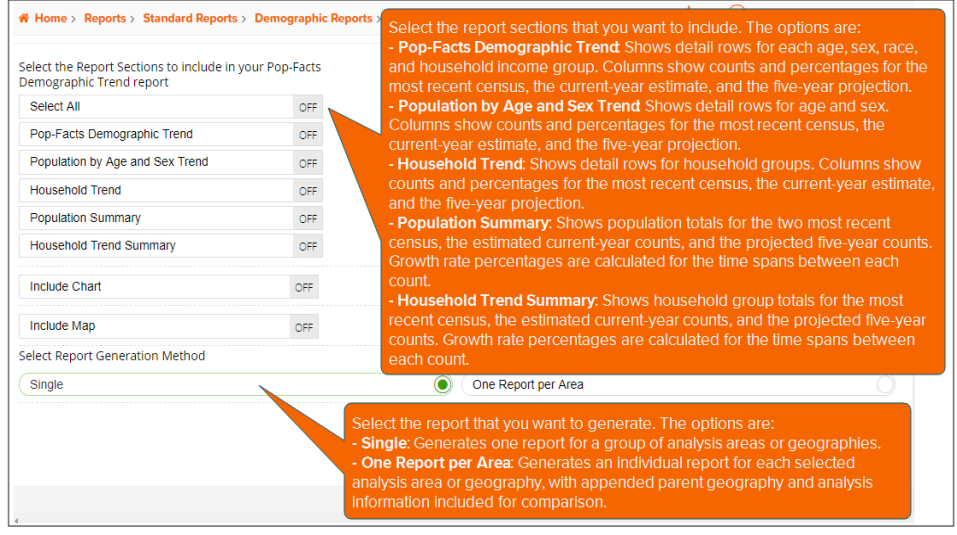
- On the screen similar to the one shown above, select the report sections that you want to include in your report by clicking the OFF button next to your desired section to set it to ON. The available sections are:
- Pop-Facts Demographic Trend: Shows detail rows for each age, sex, race, and household income group. Columns show counts and percentages for the most recent census, the current-year estimate, and the five-year projection
- Population by Age and Sex Trend: Shows detail rows for age and sex. Columns show counts and percentages for the most recent census, the current-year estimate, and the five-year projection.
- Household Trend: Shows detail rows for household groups. Columns show counts and percentages for the most recent census, the current-year estimate, and the five-year projection.
- Population Summary: Shows population totals for the two most recent census, the estimated current-year counts, and the projected five-year counts. Growth rate percentages are calculated for the time spans between each count.
- Household Trend Summary: Shows household group totals for the most recent census, the estimated current-year counts, and the projected five-year counts. Growth rate percentages are calculated for the time spans between each count.
- (Optional) If you want to include a chart and a map, click the OFF button next to the item that you want to include to set it to ON.
- (Optional) If you selected to include a map to your report, additional options appear on the screen. You can do the following:
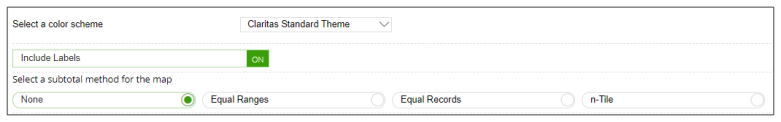
- (Optional) By default, the labels are ON if you select to include a map. To disable the label display on the map, click the ON button next to Include Labels to set it to OFF.
- Select the level of detail that you want to include in your map. The options are:
- As Selected: The thematic map is applied to the selected analysis areas.
- Component: The thematic map is applied to the components of the analysis areas. If you select this option, you need to select a geography level to use as component and the method by which you want to include the geography.
- As Reported: The thematic map is applied based on report grid selections.
- Select a subtotal method. The options are:
- None
- Equal Ranges: Groups areas (rows) based on the values of a specific variable – Each subtotal group will have an equal minimum/maximum range for the specified variable.
- Equal Geographies: Uses basic division to group the number of areas (rows) equally – Each subtotal group will have an equal number of areas.
- n-Tile: Distributes the total number of households in an area into groups that are approximately equal, such as fourths or fifths. Dividing data in equal portions ranks the analysis areas by marketing potential, in groups showing the strongest to weakest.
- (Optional) If you select Equal Ranges, Equal Geographies, or n-Tile subtotal method, you have to specify the following:
- Theme variable: The break variable is available only for n-Tile subtotal method. Select the variable that you want to use for theming or breaking or grouping data in the Select a theme variable box.
- Sort measure: In the Select a sort measure drop-down list, click to select the calculation that you want to use for sorting data. The options are:
- Base: Shows the total number of households that fall in the segment.
- Base % Comp: Shows the proportion of segment households compared to the total number of households in Base Count.
- Count: The total number of surveyed households/adults in each segment that reported using the product or service.
- % Comp: Shows the proportion of segment households/adults that fit the profile, compared to the profile’s total Count.
- % Pen: Shows the percentage of households/adults that fit the profile (Count) compared to all households in the segment (Base Count)
- Index: Compares the proportion of households/adults that use the product (% Comp) compared to the proportion of all households in the segment (Base % Comp). - Sort order or direction: Below Select a sort direction, click your desired sort order. The options are Ascending and Descending.
- Number of ranges: In the Select the number of ranges list, click your desired number of groupings.
- Specify your desired report generation method. The options are:
-
Single: Generates one report for a group of analysis areas or geographies.
-
One Report per Area: Generates an individual report for each selected analysis area or geography, with appended parent geography and analysis information included for comparison.
- Select your desired output format. The options are PDF, Excel, and PDF and Excel.
- Click Next to proceed.
What's Next:
Pop-Facts Demographic Trend Report: Specify the Report Output Format and Name