Pop-Facts Executive Summary Report: Define the Report Generation Method, Output Format, and Report Name
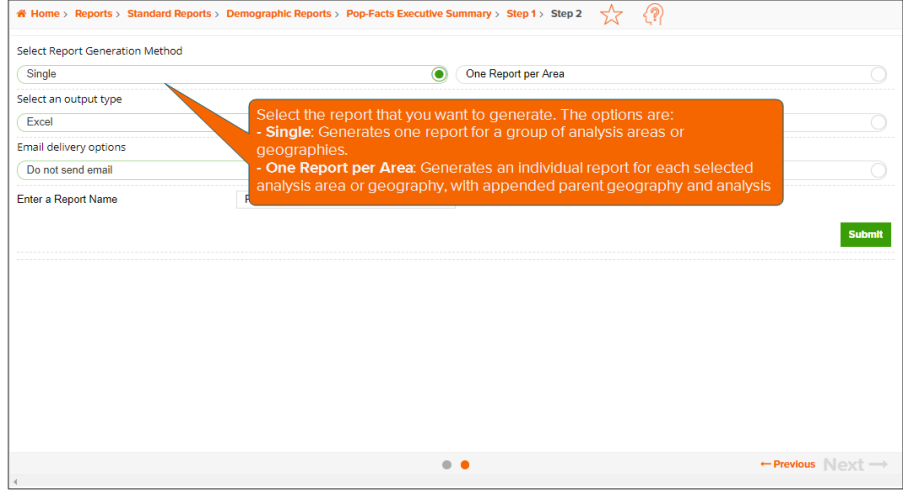
On the screen similar to the one shown below, specify your preferred report generation method, the report output format, your preferred notification method once the report has been generated, and the report name.
(Optional) You can also specify to include a map in your report.
NOTE: Note: If you select One Report per Area as the report generation method, the following special characters cannot be used in the report name: * | ' / \ ”
NOTE: The Step number assignment that displays on top of the screen and the available options may differ depending on the selections that you have made on the previous screen, your device, and/or screen resolution.
After you specify your settings, click Submit.
You can view the report generation status and the generated report on the My Jobs screen.
To Learn More:
NOTE: Depending on your screen resolution or device, some of the options mentioned below may not appear on this screen and you may need to go to the next screen to complete the process. Simply follow the instructions below to set those parameters or refer to the Help provided for the next screen.
- (Optional) On the screen similar to the one shown above, if you selected to include a map to your report, additional options appear on the screen. You can do the following:
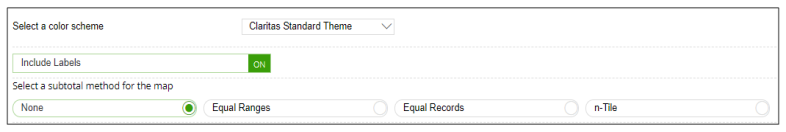
- In the Select a color scheme drop-down list, select the color theme that you want to use in your map.
- (Optional) By default, the labels are ON if you select to include a map. To disable the label display on the map, click the ON button next to Include Labels to set it to OFF.
- Select the level of detail that you want to include in your map. The options are:
- As Selected: The thematic map is applied to the selected analysis areas.
- Component: The thematic map is applied to the components of the analysis areas. If you select this option, you need to select a geography level to use as component and the method by which you want to include the geography.
- As Reported: The thematic map is applied based on report grid selections.
- Select a subtotal method. The options are:
- None
- Equal Ranges: Groups areas (rows) based on the values of a specific variable – Each subtotal group will have an equal minimum/maximum range for the specified variable.
- Equal Geographies: Uses basic division to group the number of areas (rows) equally – Each subtotal group will have an equal number of areas.
- n-Tile: Distributes the total number of households in an area into groups that are approximately equal, such as fourths or fifths. Dividing data in equal portions ranks the analysis areas by marketing potential, in groups showing the strongest to weakest.
- (Optional) If you select Equal Ranges, Equal Geographies, or n-Tile subtotal method, you have to specify the following:
- Theme variable: The break variable is available only for n-Tile subtotal method. Select the variable that you want to use for theming or breaking or grouping data in the Select a theme variable box.
- Sort measure: In the Select a sort measure drop-down list, click to select the calculation that you want to use for sorting data. The options are:
- Base: Shows the total number of households that fall in the segment.
- Base % Comp: Shows the proportion of segment households compared to the total number of households in Base Count.
- Count: The total number of surveyed households/adults in each segment that reported using the product or service.
- % Comp: Shows the proportion of segment households/adults that fit the profile, compared to the profile’s total Count.
- % Pen: Shows the percentage of households/adults that fit the profile (Count) compared to all households in the segment (Base Count)
- Index: Compares the proportion of households/adults that use the product (% Comp) compared to the proportion of all households in the segment (Base % Comp). - Sort order or direction: Below Select a sort direction, click your desired sort order. The options are Ascending and Descending.
- Number of ranges: In the Select the number of ranges list, click your desired number of groupings.
- Specify your desired report generation method. The options are:
-
Single: Generates one report for a group of analysis areas or geographies.
-
One Report per Area: Generates an individual report for each selected analysis area or geography, with appended parent geography and analysis information included for comparison.
- Select your desired output format. The options are PDF, Excel, and PDF and Excel.
- Select your preferred notification method once the report has been generated.
- Type a report name in the Enter a Report Name text box.
- Verify your settings and then click Submit.
- When a message box appears giving you the following options, click the next action that you want to do:
- Create another report of this type: Takes you to the appropriate report prompts for the current report that you are generating.
- Create a different report type: Takes you to the Reports home page.
- Go to My Content: Takes you to the My Content page, where you can access all generated assets.
- Go to My Jobs: Takes you to the My Jobs screen, where you can view the report generation status and the generated report.
NOTE: If you do not click any of the options, the system automatically takes you to the Job Export page containing tiles for possible actions on what you can do with your output.