Consumer Concentration Report: Select an Analysis Area, the Level of Detail, and a Sort Method
On the Step 2 screen, select a geography or an analysis area for which you want to generate the report, the level of detail that you want to include in your report, and your preferred sorting method for the data.
(Optional) You can update the analysis area for calculating the report index.
(Optional) You can also include a map in your report.
Additional considerations:
- A maximum of 10,000 custom analysis areas can be included in the report output. However, there are no limits on standard geographies.
- When selecting the analysis areas or standard geographies you want to include in the report, clicking on the folder (without opening it) will select all areas contained within the folder.
- Use the Search function to locate your desired analysis areas.
- Use the Save List button to save your selected list of analysis areas for future use.
- Use the My Lists button to load a previously saved list of analysis areas.
- You can specify to append parent geographies in your report output.
NOTE: The Step number assignment that displays on top of the screen and the available options may differ depending on the selections that you have made on the previous screen, your device, and/or your screen resolution.
After reviewing your settings, click Submit.
To Learn More:
|
Consumer Concentration Report - Interpretation & Calculations |
|
|
Consumer Concentration Report - Understanding the Index Options |
|
NOTE: Depending on your screen resolution or device, some of the options mentioned below may not appear on this screen and you may need to go to the next screen to complete the process. Simply follow the instructions below to set those parameters or refer to the Help provided for the next screen.
- On the Step 2 screen, navigate to and select the geography or analysis area for which you want to generate a report. You can also use the Search function to look for your desired area.
A maximum of 10,000 custom analysis areas can be included in the report output. However, there are no limits on standard geographies. -
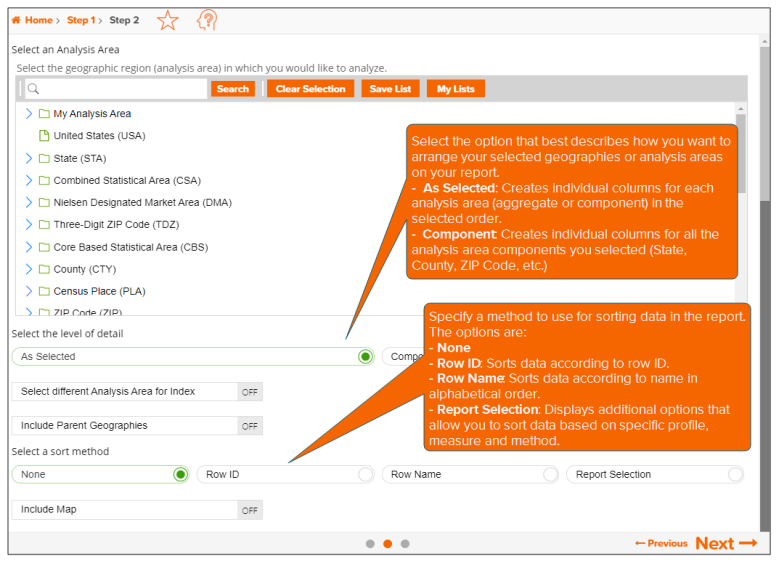
Below Select the level of detail, click the option that best describes how you want to arrange your selected geographies or analysis areas in your report. The options are:
-
As Selected: Creates individual columns for each analysis area (aggregate or component) in the selected order.
-
Component: Creates individual columns for all the analysis area components you selected (State, County, ZIP Code, etc.). If you select this option, you need to select a geography level to use as component and the method by which you want to include the geography.
- (Optional) To update the analysis area (a single geography) that will be used to calculate the report index, click the OFF button next to Select different Analysis Area for Index to set it to ON. You will then be prompted to select the geography that you would like used for the index calculation.
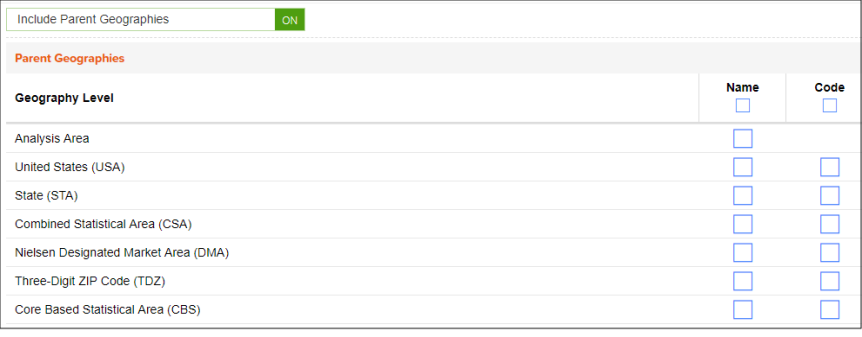
Note: The default is that the selected analysis areas will be the base for the index calculation. Setting this option to ON will allow users the ability to select a consistent geography for calculating index, regardless of the number of analysis areas selected. - (Optional) To append parent geographies to the report, click the OFF button next to Include Parent Geographies to set it to ON. When the Parent Geography pop-up window appears, click the Name and/or Code check box next to the parent geography(ies) that you want appended to the report.
- (Optional) Specify a method to use for sorting data in the report. The options are:
- None - No sort method is applied.
- Row ID - Sorts data according to row ID.
- Row Name - Sorts data according to name in alphabetical order.
- Report Selection - Sorts data based on a specific variable and measure.
- (Optional) If you selected Report Selection as your sort method, you need to specify a sort variable and a sort measure.
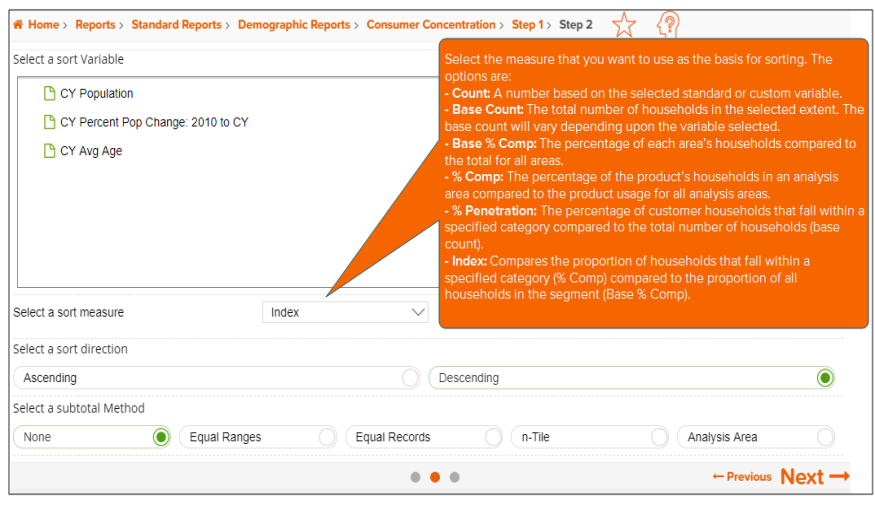
- Specify your preferred sort direction. The options are Ascending and Descending.
- (Optional) If you selected Report Selection as your sort method, you need to specify a subtotal method for sorting the data in your report. The subtotal method options are:
- None: No method is applied.
- Equal Ranges: Groups areas (rows) based on the values of a specific variable – Each subtotal group will have an equal minimum/maximum range for the specified variable.
- Equal Records: Uses basic division to group the number of areas (rows) equally – Each subtotal group will have an equal number of areas.
- n-Tile: Distributes the total number of households in an area into groups that are approximately equal, such as fourths or fifths. Dividing data in equal portions ranks the analysis areas by marketing potential, in groups showing the strongest to weakest.
- Analysis Area: Groups the records by the selected analysis areas.
- If you selected the Equal Ranges or Equal Records subtotal method, you need to specify the following:
- Number of ranges: In the Select the number of ranges drop-down list, click your desired number of groupings.
- If you selected the n-Tile subtotal method, you need to specify the following:
- Number of ranges: In the Select the number of ranges drop-down list, click your desired number of groupings.
- Subtotal measure: In the Select a Subtotal Measure drop-down list, click the desired measure to use for equal grouping.
- If you selected the Analysis Area subtotal method, you need to specify the following:
- Display and calculate data for each duplicate geography. The options are:
- Only once: The report output will not contain any duplicate records (geographies).
- In subtotals only: The report output will contain any duplicate geographies in the subtotals, but not the total.
- In all totals: The report output will contain duplicate geographies in both the subtotals and total.
- (Optional) To include a map in your report, click the OFF button next to Include Map to set it to ON. Additional options appear.
-
By default, Include Labels is set to ON. To disable the labels, click the button to set it to OFF.
-
In the Select a color scheme drop-down list, select the color theme that you want to use in your map.
- Click Next to proceed.
What's Next:
Consumer Concentration Report: Specify a Sort Method, Report Output Type and the Report Name